
Hi,
Yesterday I finally got some time to measure around my PB13.
The most important reason was I wanted to check if the SVS was positioned well against the wall. (since I'm about to construct a piece of furniture that would make the current position of the sub rather permanent...)
Basically, sound quality is good (I think) through my Onkyo 875 with a Audessey engaged. I just wanted to "see" what Audessey would / would not have to compensate for...
After doing all the calibrations (soundcard + dB-meter) , loading the RadioShack file etc I placed the RS-meter on the "sweet spot" on the couch.(in the area where also the Audessey measurements are taken)
RS-meter was positioned at about "ear level" and flat (not at 45° or something)
Look below for some graphs.
Absolute dB-values may be not super accurate, but I'm more interested in the "shape" because I want to see what my large 8000cubic feet space does to the spectrum using a single PB13.
First measurement taken direct on the PB13 - bypassed Onkyo+Audessey (2 same graphs, different scale)
![Image]()
![Image]()
Second measurement taken through the whole chain (including Audessey)
![Image]()
![Image]()
Now, to ME it doesn't look that bad.
My PB13 is tuned to 15Hz so you see the steep rise @ 15Hz
Around 100Hz it goes down rapidly (Onkyo X-over value, 90Hz)
These graphs do not represent maximum output in any way, but I think the "shape" should be valid even if I'm some dB's off due to calibration-mismatch or whatever.
What do the more experienced user say about such response-graphs ?? :hide: :reading:
Thanks & regards,
Jan
Yesterday I finally got some time to measure around my PB13.
The most important reason was I wanted to check if the SVS was positioned well against the wall. (since I'm about to construct a piece of furniture that would make the current position of the sub rather permanent...)
Basically, sound quality is good (I think) through my Onkyo 875 with a Audessey engaged. I just wanted to "see" what Audessey would / would not have to compensate for...
After doing all the calibrations (soundcard + dB-meter) , loading the RadioShack file etc I placed the RS-meter on the "sweet spot" on the couch.(in the area where also the Audessey measurements are taken)
RS-meter was positioned at about "ear level" and flat (not at 45° or something)
Look below for some graphs.
Absolute dB-values may be not super accurate, but I'm more interested in the "shape" because I want to see what my large 8000cubic feet space does to the spectrum using a single PB13.
First measurement taken direct on the PB13 - bypassed Onkyo+Audessey (2 same graphs, different scale)


Second measurement taken through the whole chain (including Audessey)
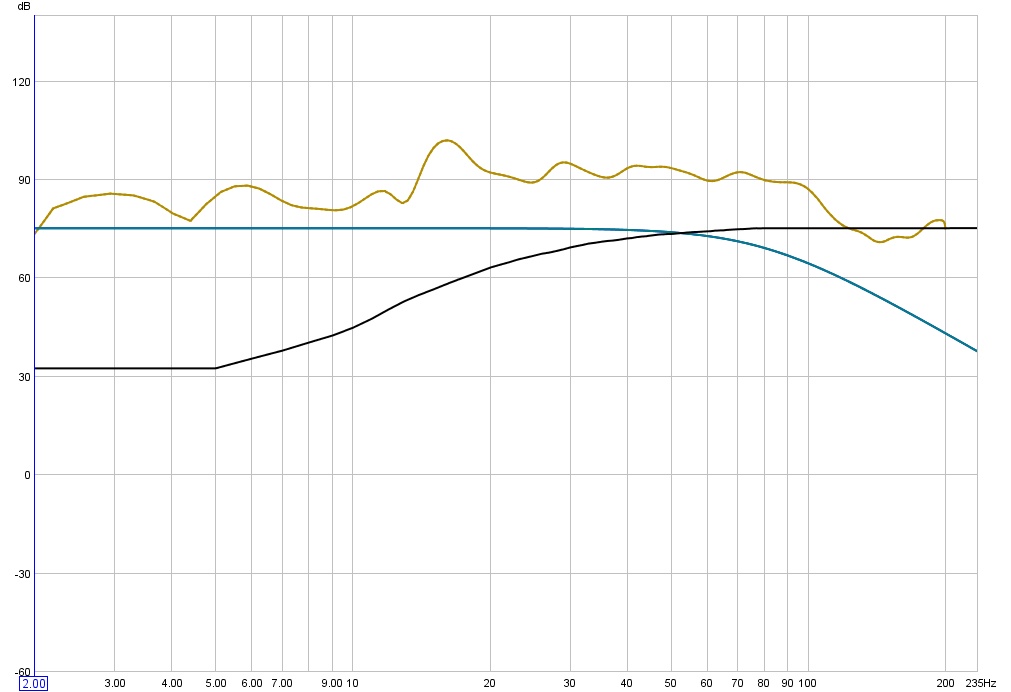

Now, to ME it doesn't look that bad.
My PB13 is tuned to 15Hz so you see the steep rise @ 15Hz
Around 100Hz it goes down rapidly (Onkyo X-over value, 90Hz)
These graphs do not represent maximum output in any way, but I think the "shape" should be valid even if I'm some dB's off due to calibration-mismatch or whatever.
What do the more experienced user say about such response-graphs ?? :hide: :reading:
Thanks & regards,
Jan
")


